Marketing Pressure: The Key Ingredient for Optimizing Your Sending Strategy
Published on May 02, 2019/Last edited on May 02, 2019/9 min read

Anna Mongillo
Business Intelligence Analyst at BrazeLet’s talk timing.
The old proverb doesn’t lie: timing is everything. You wouldn’t ask a friend for a favor when they’re tired, or busy doing something else. You wouldn’t buy stock when the prices are high…or you shouldn’t, anyway. For marketers, the same rules apply—especially when it comes to engaging your users. Thoughtful brands pay attention to when and how often they’re connecting with customers. Is it too little, too much...or just right?
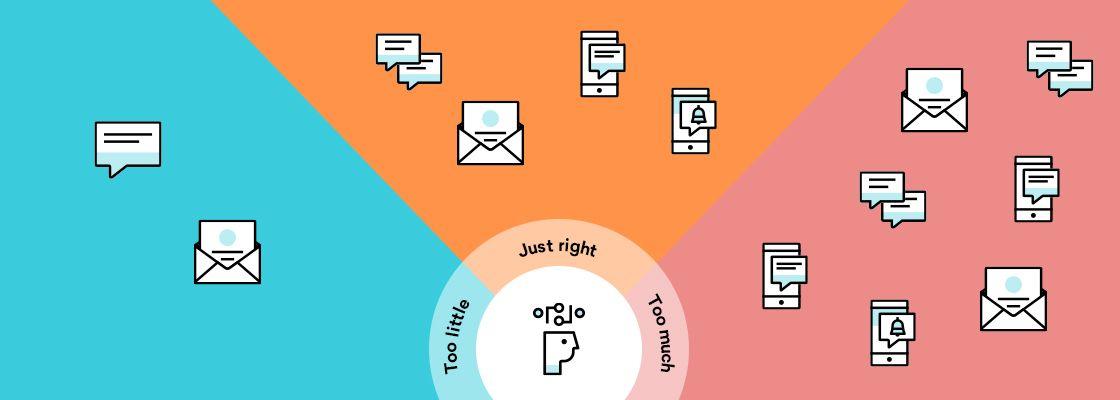
This concept is called marketing pressure. Marketing pressure refers to the quantity, timing, and pattern of a brand’s interactions with its customers. It’s a great lever for optimizing your marketing strategy—and better understanding your users to boot.
Let’s break it down a bit. We’ll talk about what makes up marketing pressure, how to calculate it, and what this metric is good for.
Frequency + Cadence: A Recipe for Success
Many marketers think of marketing pressure as a synonym for marketing frequency. Here at Braze, we take a more nuanced, comprehensive point of view—one that also takes cadence into account. In our view, frequency and cadence are two indivisible parts of your strategic whole; when joined together properly, they form a balanced, holistic marketing optimization strategy. But like any two ingredients, each adds its own unique flavor to the pot. So, what’s the difference between the two?

Frequency
Frequency can be defined as the number of messages you’re sending to a given user within a period of time. You may want to calculate frequency if you’re unsure how your users will respond to varying levels of contact with your brand. In some cases, this will seem intuitive; for example, it makes sense for daily deal sites to send multiple marketing messages per day, but not so much for a furniture brand. Ask yourself: do your users tend to engage more with your messaging when you connect with them on a daily or weekly basis? Or is there evidence that they feel overwhelmed by that kind of messaging volume?
Cadence
Cadence refers to the timing and pattern of messages sent to a given user. That means looking at the time of day or day of week that you’re sending out messages, as well as the amount of time that elapses between messages. You’ll want to take a look at cadence if you’re curious when a user is most likely to open a message, engage with it, and receive value from it. For instance, cadence is relevant if you have a product with a sales cycle you’d like to optimize around—think scheduling an international vacation. A longer sales cycle might call for longer intervals between messages, whereas a shorter one might necessitate the opposite.
Frequency and cadence are the salt and pepper of your sending strategy. Combine them right, and you’ll taste the reward.
Measuring Out Your Ingredients
When it comes to measuring frequency and cadence, you’ll want to customize your analyses based on the specific needs of your brand. But while the exact methods you use to calculate marketing pressure will vary depending on your data’s source and location, it may be helpful to consider some general examples. Let’s take a look at frequency first.
Say you’re working with event-based data, like the data coming from our Braze Currents data export tool. To calculate frequency, you’ll first want to partition your data by a few dimensions: the date granularity of your choosing (day, week, or month, depending on your use case), each individual’s user identifier or email address, and a rollup of high-level metrics like deliveries and opens. That will produce a table like this one:
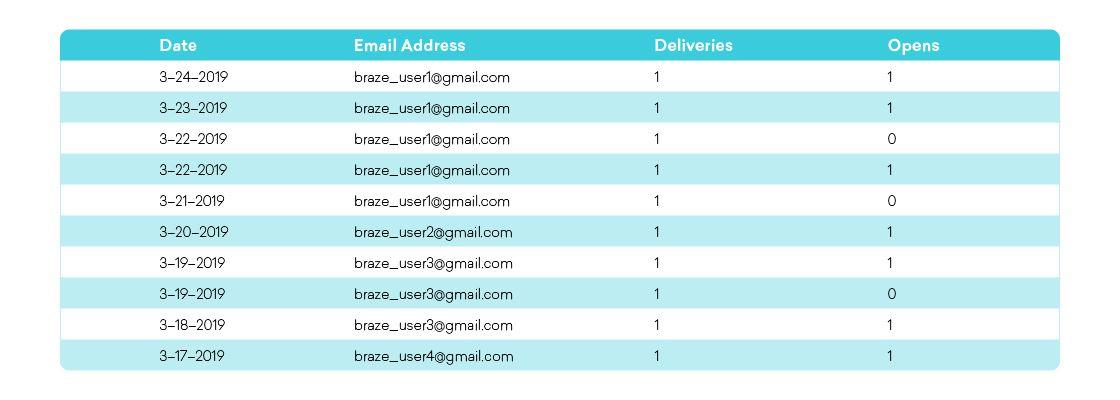
Using this kind of data, we can identify what kind of messaging volume a given user tended to receive within a certain period of time—and more importantly, how that messaging volume affected engagement rates. For example: in this data set, it looks like there were 6 users that received 1 email per day, and out of those users there were 5 email open events. 5 opens ÷ (1 email X 6 users) ≈ 0.83, or an 83% open rate for users that received 1 email per day. There were only 2 users that received 2 emails per day, and 2 open events corresponding to those users. 2 opens ÷ (2 emails X 2 users) = 0.5, or a 50% open rate for users that received 2 emails per day. And so on. With a larger dataset, you’ll be able to perform a much richer analysis.
Let’s move on to cadence. If you have data that details the days and times on which your users are most likely to engage with your messaging, cadence will be easy to calculate. For example, simply by converting the dates in the data above to days of the week and rolling up the corresponding statistics, we get the following table:

Although this data is limited, it can provide an idea of what you’ll be able to do with more granular event-based data. Every data model and source is different; if you have days and times included in your data, you can fine-grain this process down to the hour or even the minute.
Cadence also has to do with the amount of time between messages. From the above data, we can summarize each stat grouped by the number of days between each email:

Here, we see that both same-day emails and emails with 1 day between them had a 50% open rate. Again, every data source is different, and every business model has its own requirements, so you should perform this analysis yourself to find out what works best for your brand’s particular use cases. But when your team analyzes cadence, this is the kind of data you’ll want to be looking at.
Dig Into The “Why”
Now that you’ve established a few benchmarks around your brand’s marketing pressure, you might be asking yourself: why do your users prefer, say, two messages per week over four or five?
It all depends. Every user is different. Perceptions of marketing pressure don’t exist in a vacuum; your optimal send frequency and cadence are likely to be influenced by things like the quality of the message, its relevance to the user, and what kinds of additional messaging the user is receiving from other brands. You could send out messaging at the optimal volume or time and still see poor results, simply because your messaging is incomplete, inconsistent with your brand, or out of line with the user’s preferences. That’s why making use of advanced tactics like segmentation, triggering, and personalization is so important when it comes to engaging your users. So while you’re doctoring up your sending strategy, don’t forget that what’s optimal for some may feel invasive for others, and focus on the quality of your messaging first and foremost.
You’ll also have to consider the unique brand relationship you’ve developed with each customer. That relationship is a key factor in determining whether a given user will welcome an interaction with your brand or not. While the amount of contact you have with a customer has a good chance of affecting that relationship one way or another, you should still keep in mind that any existing brand loyalty will likely color a user’s view of your messaging. That means it’s probably necessary to take different approaches when dealing with, say, a prospect, a lapsing user, and a brand ambassador, respectively.
Cooking Up an Action Plan
Okay, so you’ve discovered your users prefer X amount of messages in one week, and are most likely to engage with those messages on X day of the week at 5pm. What should you do about it? Well, there are a few ways you can put your marketing optimization strategy into practice.
First of all: continual, holistic testing. Your users’ preferences are constantly changing, whether you’re acknowledging it or not. Compare and contrast how different sending frequencies and cadences affect engagement. Try switching it up. See how a group responds to one message per week, then two. Factor in messaging channel, platform, and purpose. Try sending more messages to users who frequently open, click, or convert, or sending fewer messages to lapsing users, or spacing out your messages with more, or fewer, days between each one. Any and all of these tactics could be valuable; it all depends on your users and their particular behaviors.
Second: focus on reducing unsubscribes, uninstalls, and opt-outs as much as you focus on engagement. For example, give your users the choice to opt-down in lieu of unsubscribing or opting out. Setting up a preference center is a great way to collect information about your users—particularly the type of messaging, the frequency, and the cadence they prefer—in order to avoid unsubscribes. Encourage your users to utilize the preference center; make it a priority to understand them and provide them with value.
Finally: use all of this information to inform better segmentation. Collect data throughout the user lifecycle, and based on how each individual interacts with your brand, build out messaging frequencies and patterns that are more personalized and relevant based on that user’s engagement style.
Braze: The Cherry on Top
The Braze platform is explicitly built to help brands execute on perfectly timed and triggered campaigns. While you experiment with marketing pressure, definitely make use of Braze features like Intelligent Delivery, which ensures your users receive messages from your brand at the exact moment when they are most likely to engage. Continue to segment, personalize, trigger and test. Map out each customer journey using Braze Canvas, our drag-and-drop journey management tool. With Braze, you have a broad array of tools at your disposal for optimizing and iterating.
So let’s get moving. Time’s a-wastin’!
Stuck?
Short on time or resources for analyzing your brand’s marketing pressure? You’re in luck. Here at Braze we’ve taken big steps to make your raw data more accessible and valuable. Check out the second release of our Message Engagement Looker Block, which leverages data from our Currents product to analyze marketing pressure using both messaging frequency and cadence, so that you can just plug-and-play.
Related Tags
Releated Content
View the Blog
2.4+ billion sends, zero fumbles: How Braze supports leading brands during the big game

Jamie Doheny
Beyond Predictions: Why Your Personalization Strategy Needs an AI Decisioning Agent

George Khachatryan
The OS and inbox as intermediary: How AI is (literally) rewriting customer engagement
